Technicians use historical charts, data, and trendlines in predicting future stocks. This method of trading is called technical trading. In technical trading, there are trends that are used to draw conclusions, and these trends are called patterns. Having looked at flag pattern and channel pattern, we will now look at head and shoulders pattern.
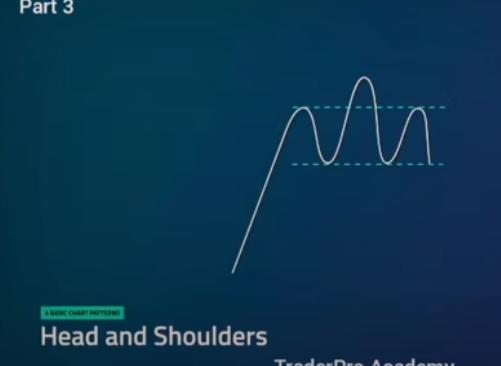
This trading pattern is very popular and you can easily spot it using technical analysis. It appears as a baseline having three peaks with the middle one being higher than the others.
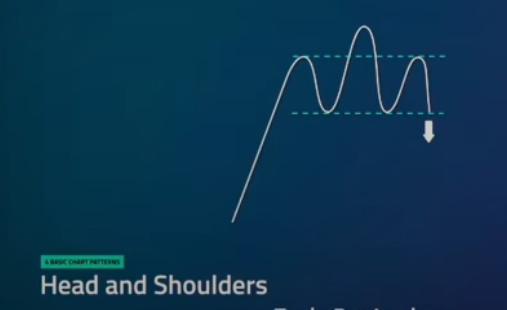
A chart of head and shoulders trading pattern shows a reversal trend from bullish to bearish which indicates that the upward trend is almost ending.
Implementing the formation is very easy looking at the price targets, the entry levels and the stop levels which are very visible and important as well.
Head and Shoulders Pattern Formation
- The left shoulder-The price rises, attains its peak and then declines
- The head- The price rises again and forms a higher peak
- The right shoulder- The price declines again and rises forming a peak on the right, but lower than that of the head
However, it is very rare to find a perfect formation. This means that there would be noise in between the head and the shoulders.
Inverse Head and Shoulders Pattern Formation
This is the reverse situation of the head and shoulders pattern and occurs during the market bottoms. In this case we will have;
- The left shoulder-The price declines, attains its bottom and then rises
- The head- The price declines to form a lower bottom
- The right shoulder-The price rises again and then declines forming a bottom on the right
The Neckline
This is the resistance or support level that the traders use in determining where to place their orders. The first procedure for placing the neckline is locating the right shoulder, the head and the left shoulder on the provided chart. In the market top, we create the neckline by connecting the low between the head and the right shoulder with the low between the left shoulder and the head. In the market bottoms, we connect the high between the head and the right shoulder with the high between the left shoulder and the head.
How To Trade The Head and Shoulders Trading Pattern
It is very important to trade only after the pattern has broken the neckline. Otherwise, an incomplete pattern may eventually fail to complete or a pattern may even fail to develop. For the head and shoulders pattern, we have to wait until the price action moves below the neckline after the right shoulder’s peak. The same applies to the inverse head and shoulders pattern. It is only that in this case we will have to wait until the price action moves above the neckline after the formation of the right shoulder.
Once the pattern is complete, you can proceed and initiate the trade. Note down your profit targets, your entry as well as your stops. Also don’t forget to mention the variables which may come in between. The common point of entry though is often during the breakouts. Afterwards, you will have to wait for a pullback in order to make access another entry point. Once the pullback comes to an end, the price resumes the breakout direction. However, when the price still resumes the breakout direction, you my miss the trade.